
Bridge statistics, manga and SQL
I didn't enjoy stats at school very much. It seemed a very dry subject that involved a lot of tedious calculations and I didn't really see the point. Perhaps if we'd been encouraged to use computers to do the tedious stuff and been given data sets that were more interesting I'd have realised that actually stats can be a very interesting subject.
After reviewing and enjoying The Manga Guide to Relativity, I was excited to be sent a copy of The Manga Guide to Statistics to review. It inspired me to look at statistics again. Perhaps they do have a point, perhaps with some interesting data and a computer doing the tedious number crunching the numbers will come to life. As I didn't really listen at school to this subject, I had a lot of catching up to do and this book was really going to have to grab my attention to convince me that statistic could be interesting.
I enjoyed the Manga guide to Relativity so much that this book had a lot to live up to and initially I felt a bit let down. I think that has a lot to do with the subject matter. Statistics is just a subject that doesn't interest me as much as the fundamental wierdness of the universe. On my first attempt at reading The Manga Guide to Statistics, I treated it like a book. It's very heavy in numbers. I found that it was hard to follow and the facts did not stick in my head. But, it's not really a normal book. It's a text book and should be treated as such. That means you need to read a bit and then do some exercises that practice what you've learnt.
When used like this the Manga Guide to Statistics is an excellent text book for someone trying to learn about stats. The story and illustrations keep you engaged and are an excellent starting point to apply the concepts to your own data. They also do a really good job of illustrating the concepts in a way that makes sense and gives you a mental model of what is being explained.
While reading through the book I decided to apply my new stats knowledge to a data set that I've been working with a lot lately. Pianola is a web app for Bridge clubs. This means I have access to a lot of raw numbers about bridge and I decided that would be my data set. I also wanted to write a set of SQL scripts that would help me get the statistical data that I was interested in. SQL was the thing that was going to do the number crunching for me.
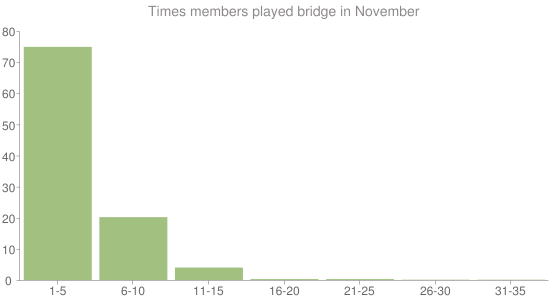
When I first started work on Pianola I was surprised at just how much people play bridge. The graph above is a histogram that shows how often the people using Pianola played bridge at their bridge clubs in November.
A histogram is a useful way of visualising a set of data. In this case I'm looking at how often people play bridge in a month. Rather than plot a bar for every different number of times someone has played bridge, I've grouped them up into classes that group 5 numbers together.
I could have plotted the number of people in each class. This would have been the frequency of that class. Instead I've plotted the relative frequency, which is the percentage of that frequency in relation to the total frequency of all classes. Our total frequency is the total number of Pianola members who played bridge in November. 74% of our members' played bridge 1 to 5 times in November. A far smaller number, 0.4% played bridge 31 to 35 times in November. Some people are very keen, and our histogram shows this very clearly.
Pianola keeps track of the games everyone plays, but to count the number of games everyone played and then to count the number of people who played a certain number of games took a bit of working out. [Note: All the SQL in this post was written for MS SQL Server 2008 and may need tweaking to run on a different database.]
First I stored the number of times everyone has played in a temporary table:
CREATE TABLE #PlayCounts(mId int, playCount int );
GO
// Store start and end date in variables so we can easily change date range
declare @startDate datetime, @endDate datetime
set @startDate = '2011-11-01'
set @endDate = '2011-11-30'
INSERT INTO #PlayCounts(mId, playCount)
(SELECT MemberId mId, COUNT(MemberId) playCount
FROM Game
WHERE [DateTime] BETWEEN @startDate AND @endDate
GROUP BY MemberId);
GO
Now we have the number of times everyone has played we can count the number of members who have played a certain number of times. I wasn't sure if I could easily group the counts up into classes of values, but this funky SELECT CASE statement and this Stackoverflow question on grouping by ranges in SQL came to my rescue.
DECLARE @totalFrequency int;
SET @totalFrequency = (SELECT COUNT(*) FROM #PlayCounts);
SELECT t.range as [score range], COUNT(*) as frequency, (COUNT(*) / CONVERT(FLOAT, @totalFrequency))*100 as [relative frequency]
FROM
(
SELECT CASE
WHEN playCount BETWEEN 1 AND 5 THEN '1-5'
WHEN playCount BETWEEN 6 AND 10 THEN '6-10'
WHEN playCount BETWEEN 11 AND 15 THEN '11-15'
WHEN playCount BETWEEN 16 AND 20 THEN '16-20'
WHEN playCount BETWEEN 21 AND 25 THEN '21-25'
WHEN playCount BETWEEN 26 AND 30 THEN '26-30'
WHEN playCount BETWEEN 31 AND 35 THEN '31-35'
WHEN playCount BETWEEN 36 AND 40 THEN '36-40'
ELSE 'other' end as range
FROM #PlayCounts
)t
GROUP BY t.range
ORDER BY frequency DESC
DROP TABLE #PlayCounts;
In my select statement I've worked out both the frequency and the relative frequency of each class. I can easily re-run the query for different date ranges. It should also be pretty easy to take this SQL and rewrite it to look at different data sets.
Next I read about the mean and the median. The mean is the more accurate term for what we mostly call the average and can be worked out in SQL really easily. The only slight complication is that we need to convert playCount to a float so that the AVG function returns a float and doesn't round the number to an integer.
SELECT AVG(CONVERT(FLOAT, playCount)) AS Mean FROM #PlayCounts;
The median is the frequency for the person in the middle if you order everyone by how often they play. There's no built in SQL command for this, but this Stackoverflow answer for median SQL sorted me out.
SELECT
(
(SELECT MAX(playCount) FROM
(SELECT TOP 50 PERCENT playCount FROM #PlayCounts ORDER BY playCount) AS BottomHalf)
+
(SELECT MIN(playCount) FROM
(SELECT TOP 50 PERCENT playCount FROM #PlayCounts ORDER BY playCount DESC) AS TopHalf)
) / 2 AS Median;
For our bridge dataset the mean number of times someone played in a month was 4.22, and the median was 3. The median value can give you a more accurate view of the behaviour of most people. If one person played bridge 120 times a month they could skew the mean and give a false impression. In our case the two values are quite close.
This is all quite basic statistics. So basic I actually remember most of it from school, but The Manga guide provides a good reminder in the first two chapters. One last thing from those chapters is standard deviation, which is starting to get a bit more advanced. Standard deviation describes how scattered the data is. The more data varies from the mean, the higher the standard deviation.
Here is the very easy SQL to work it out:
SELECT STDEV(playCount) AS [Standard deviation] FROM #PlayCounts;
The standard deviation for our set is 3.41. I think this is quite low.
That's as far as I've got so far and I wouldn't want to spoil the whole book for you. The joy in it for me has been thinking of places in my projects I could use the statistical methods I've learnt about. The histogram alone is a really nice device that jumped out at me as something that would be useful to the projects I'm working on. So, if you think that you could do with improving your statistics then this is a great book to work through, particularly if you have a dataset that you'd like to work with and make more sense of.
However, if you really want to be inspired about how great statistics are then you really should watch the video of this presentation by Hans Rosling. I saw it at Thinking Digital in 2009 and was blown away by his enthusiasm.